
Franklin Electric 15-Min Chart Shows Downward Expanding Bollinger, Bearish Marubozu
ByAinvest
Friday, Aug 30, 2024 12:36 pm ET1min read
FELE--
Bollinger Bands, a popular technical analysis tool [2], provide insight into a security's volatility by measuring its standard deviation from the moving average. An expansion of these bands indicates increased price volatility, which can be attributed to heightened uncertainty or increased risk aversion in the market. In FELE's case, the downward expansion of the Bollinger Bands suggests that sellers have been exerting significant control over the market [1].
The Bearish Marubozu candlestick pattern, formed when a security's price opens at a high, closes at a low, and remains below its opening price throughout the period [2], is a bearish reversal signal. Its presence in FELE's 15-minute chart suggests that selling pressure is dominating the market. This could be a continuation of the bearish trend that has been in effect since the beginning of August [1].
Other companies, such as MillerKnoll (MLKN) and Pulse Biosciences (PULS), have also exhibited similar patterns [1][2]. Their 15-minute charts have shown expansions of their Bollinger Bands and the formation of Bearish Marubozu candlestick patterns, indicating that selling pressure is dominating the market.
Investors should exercise caution when considering FELE's stock as part of their investment portfolios. The persisting bearish trend, signaled by the expansion of Bollinger Bands and the formation of a Bearish Marubozu candlestick pattern, could potentially lead to further declines in FELE's stock price.
Sources:
[1] A Invest. (2024, August 30). Eastern's 15-Min Chart Signals Bearish Marubozu Bollinger Bands Expansion. Retrieved from https://www.ainvest.com/news/eastern-s-15-min-chart-signals-bearish-marubozu-bollinger-bands-expansion-240810007fe4ca8e64a68155/
[2] Investopedia. (n.d.). Bollinger Bands. Retrieved from https://www.investopedia.com/terms/b/bollingerbands.asp
MLKN--
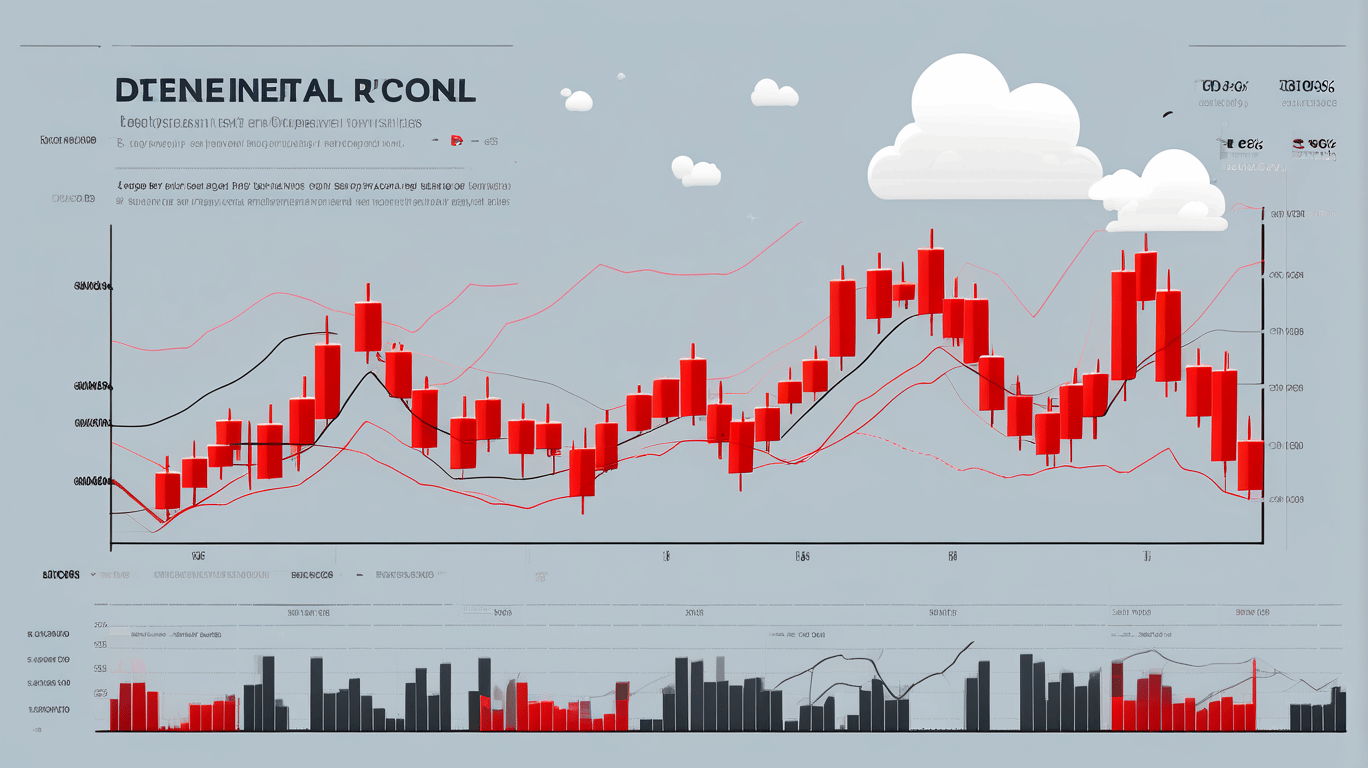
The 15-minute chart for Franklin Electric has indicated an expansion of the Bollinger Bands in a downward direction as of 12:30 PM on August 30, 2024. Additionally, the presence of a Bearish Marubozu candlestick pattern suggests that the market is being dominated by sellers, who are exerting significant control over the trading dynamics. This pattern of bearish momentum is expected to persist in the near term.
Franklin Electric (FELE) [1], a leading global provider of solutions for water and air systems, has seen its 15-minute chart indicate a potential continuation of the bearish trend. As of August 30, 2024, at 12:30 PM, the Bollinger Bands have expanded downward, and a Bearish Marubozu candlestick pattern has emerged [1].Bollinger Bands, a popular technical analysis tool [2], provide insight into a security's volatility by measuring its standard deviation from the moving average. An expansion of these bands indicates increased price volatility, which can be attributed to heightened uncertainty or increased risk aversion in the market. In FELE's case, the downward expansion of the Bollinger Bands suggests that sellers have been exerting significant control over the market [1].
The Bearish Marubozu candlestick pattern, formed when a security's price opens at a high, closes at a low, and remains below its opening price throughout the period [2], is a bearish reversal signal. Its presence in FELE's 15-minute chart suggests that selling pressure is dominating the market. This could be a continuation of the bearish trend that has been in effect since the beginning of August [1].
Other companies, such as MillerKnoll (MLKN) and Pulse Biosciences (PULS), have also exhibited similar patterns [1][2]. Their 15-minute charts have shown expansions of their Bollinger Bands and the formation of Bearish Marubozu candlestick patterns, indicating that selling pressure is dominating the market.
Investors should exercise caution when considering FELE's stock as part of their investment portfolios. The persisting bearish trend, signaled by the expansion of Bollinger Bands and the formation of a Bearish Marubozu candlestick pattern, could potentially lead to further declines in FELE's stock price.
Sources:
[1] A Invest. (2024, August 30). Eastern's 15-Min Chart Signals Bearish Marubozu Bollinger Bands Expansion. Retrieved from https://www.ainvest.com/news/eastern-s-15-min-chart-signals-bearish-marubozu-bollinger-bands-expansion-240810007fe4ca8e64a68155/
[2] Investopedia. (n.d.). Bollinger Bands. Retrieved from https://www.investopedia.com/terms/b/bollingerbands.asp
Stay ahead of the market.
Get curated U.S. market news, insights and key dates delivered to your inbox.
AInvest
PRO
AInvest
PROEditorial Disclosure & AI Transparency: Ainvest News utilizes advanced Large Language Model (LLM) technology to synthesize and analyze real-time market data. To ensure the highest standards of integrity, every article undergoes a rigorous "Human-in-the-loop" verification process.
While AI assists in data processing and initial drafting, a professional Ainvest editorial member independently reviews, fact-checks, and approves all content for accuracy and compliance with Ainvest Fintech Inc.’s editorial standards. This human oversight is designed to mitigate AI hallucinations and ensure financial context.
Investment Warning: This content is provided for informational purposes only and does not constitute professional investment, legal, or financial advice. Markets involve inherent risks. Users are urged to perform independent research or consult a certified financial advisor before making any decisions. Ainvest Fintech Inc. disclaims all liability for actions taken based on this information. Found an error?Report an Issue

ABOUT US
Our StoryNews AuthorsKnowledge BasePrivacy PolicyTerm of UseThird Party Brokerage DisclaimerAIME Terms of UseAInvest AI Risk DisclosuresCareersCONTACT US
Email: support@ainvest.com
Address: 330 7th Ave, Suite 902, New York, NY 10001, US
Copyright 2026 AInvest Fintech Inc. All rights reserved.
Comments
No comments yet